All clients have access to free analytics dashboards that provide insight into sample and testing activity over time. This article explains how to access available dashboards, and how to upgrade to unlock the full Analytics experience.
In This Article
Accessing Client Analytics Dashboards
Why are Some Dashboards Locked?
Accessing Client Analytics Dashboards
To access Client Analytics, navigate to the Analytics tab on the left hand menu.
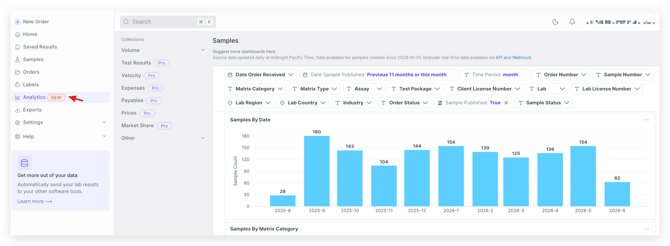
Every Client has access to the following dashboards:
- Volume (Samples & Sample-assays)
- Compounds Over Time By Sample Name
- Strain Scatterchart (For Clients testing cannabis & hemp)
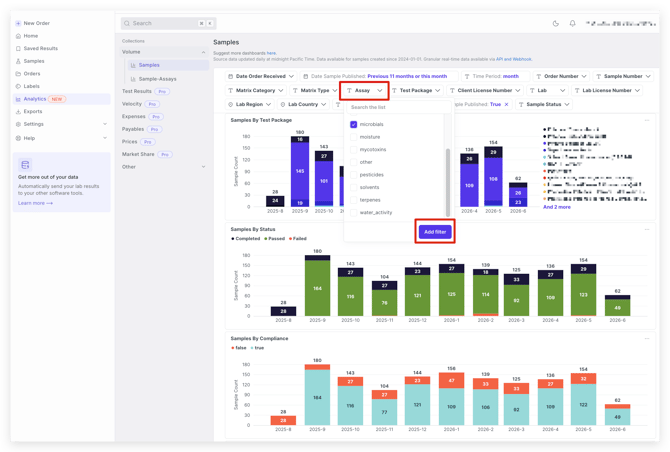
Filtering Dashboard Data
Narrow the view using filters for date range, lab, matrix category or type, assay, analyte, test package, industry, compliance, and more.
- Navigate to the Analytics tab and find the dashboard(s) you would like to filter in the Collections menu on the left.
- In the top menu, there are plenty of filters to choose from for filtering your dashboards. Select the filter(s) you'd like to apply and Add Filter
Exporting Dashboard Data
Every dashboard includes a download button, so you can export your data in different formats or save charts as an image to share with your team.
- Navigate to the Analytics tab and find the dashboard you would like to export. Apply any filters you would like to the dataset, if applicable.
- To export the entire page of dashboards as a PDF, select the Download icon in the top right

- To export a specific dashboard, find the table or chart of interest. At the top right of the table or chart, select the three dots and Download results
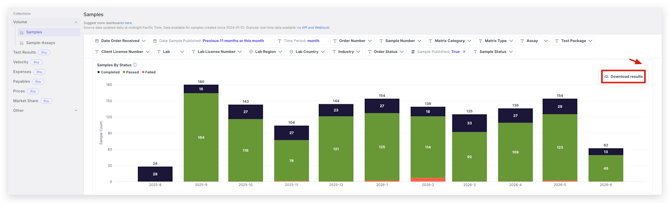
- Select which format in which you would like to download the data, and Download

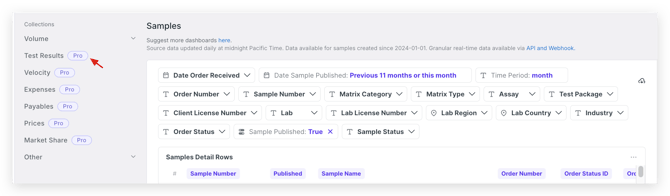
Why are Some Dashboards Locked?
Clients who upgrade to Client Pro gain access to additional analytics and powerful tools for understanding testing performance, costs, trends, and operational insights across your organization.
See the article Client Pro Analytics: Using the Full Suite of Advanced Dashboards for more information on Advanced Client Analytics.
What Additional Dashboards are Included with Client Pro?
- Test Results - Track analyte values, averages, and trends, and catch quality issues early with failure rates by assay and analyte
- Velocity - See how fast your results move, with turnaround time trends and a clear view of which samples ran late
- Expenses - Understand your testing spend at the order and sample level
- Payables - Keep tabs on outstanding balances, with line-item detail when you need to dig in
- Prices - Watch what you pay over time, with average prices by sample, test package, and sample-assay
- Market Share - See how your testing data and volume stacks up against similar clients on Confident
How do I upgrade to Client Pro?
You can upgrade to Client Pro in just a few clicks:- Simply click the Pro icon next to one of the Pro Analytics Dashboards to open a window with more information on upgrading. Select the Upgrade button in the window.
- Follow the payment flow and fill out all information to complete your upgrade.
- Once payment is confirmed, your Client Pro dashboards unlock automatically.
If you have any questions or need additional assistance, please reach out to support@confidentlims.com!